How to Quantify Achievements on Your Resume (100+ Metric Examples)

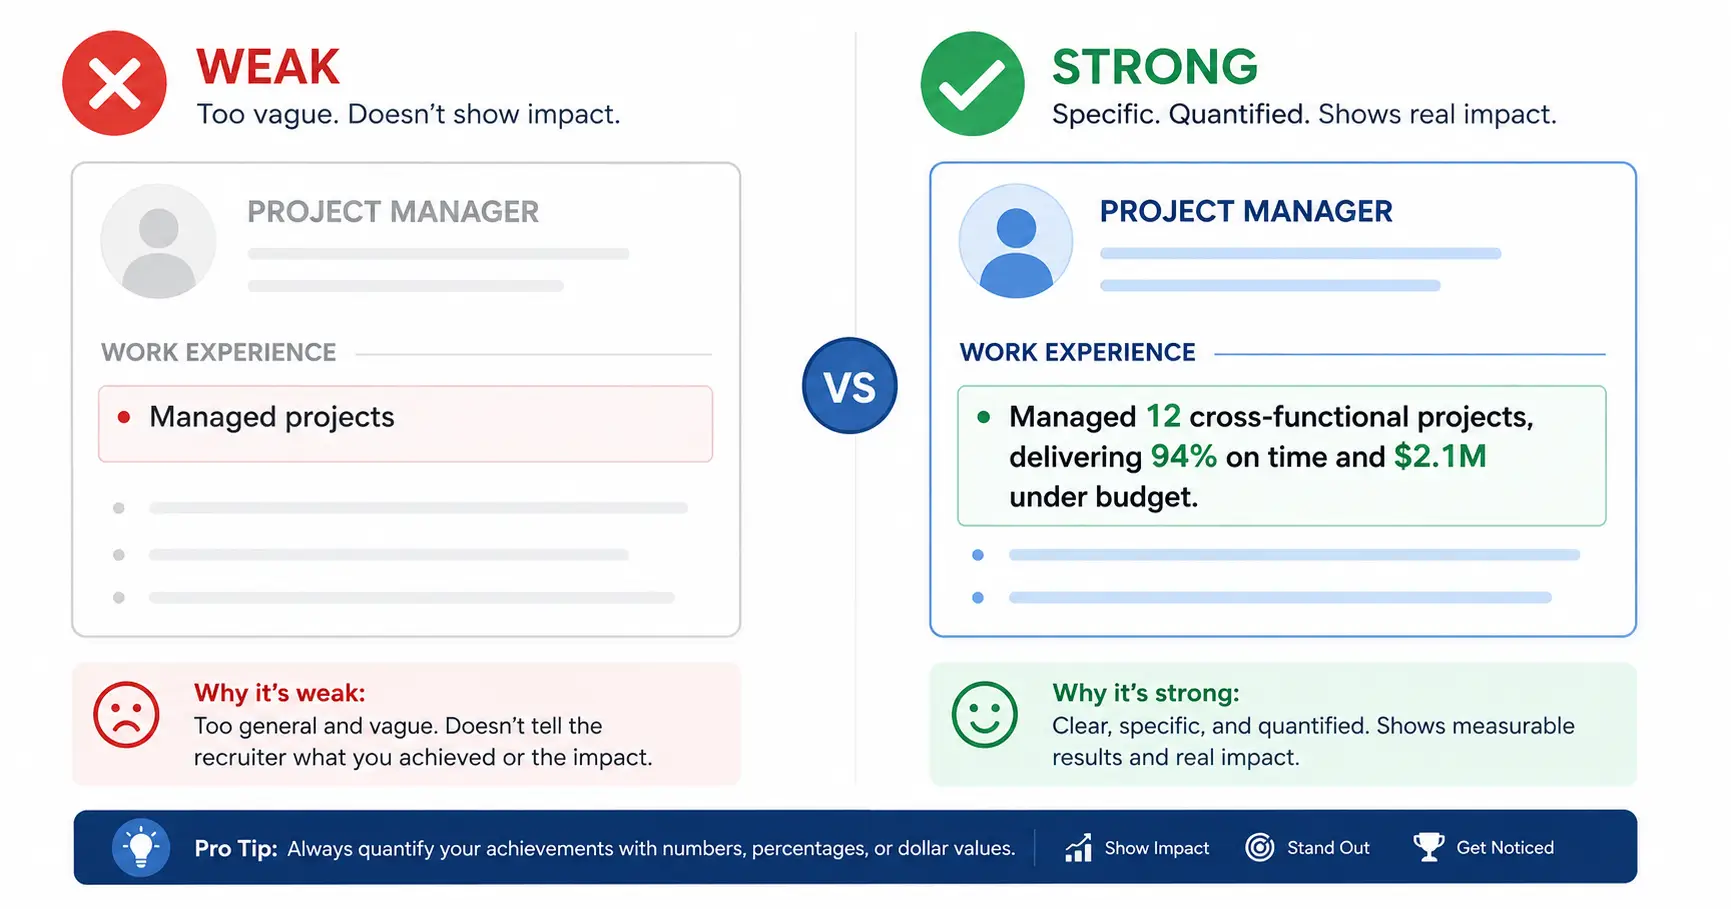
Numbers stop recruiters mid-scroll. A bullet that says "Improved customer retention" blends into every other resume on the pile. A bullet that says "Improved customer retention by 23%, saving $140K in annual churn costs" demands attention. Resumes with quantified results are up to 40% more likely to get noticed by hiring managers — yet most candidates leave their best numbers buried in memory or skip them entirely.
This guide gives you a ready-to-use library of 100+ metric examples organized by role, a framework for turning vague duties into measurable achievements, and practical methods for estimating impact when you don't have exact data.
Why Numbers Win on Your Resume
Hiring managers spend an average of 6–8 seconds scanning a resume. Numbers jump off the page because they're concrete and comparable. Here's what they do for you:
They prove impact instead of describing duties. Anyone can list responsibilities. Numbers show you actually delivered results.
They pass ATS keyword filters. Many applicant tracking systems weight measurable achievements higher when scoring relevance.
They give interviewers talking points. A specific metric invites follow-up questions — which puts you in control of the conversation.
They differentiate you from identical candidates. Two marketing managers may have the same title, but "$4.2M pipeline generated" separates one from the pack.
The formula is straightforward: Action Verb + Task + Metric + Context = compelling bullet point. The rest of this article shows you exactly how to find those metrics in your own experience.
The 5 Core Metric Types
Every quantified achievement falls into one (or more) of these categories:
- Money metrics — revenue generated, costs reduced, budget managed, deals closed, savings delivered. These carry the most weight because every company cares about financial impact.
- Time metrics — hours saved, turnaround time reduced, speed of delivery, time-to-hire shortened. Time is money's close cousin and resonates across all industries.
- Volume metrics — clients served, tickets resolved, projects completed, campaigns launched, units produced. Volume shows your capacity and workload.
- Quality metrics — error rates reduced, satisfaction scores improved, accuracy percentages, retention rates, compliance scores. Quality proves you don't sacrifice standards for speed.
- Scale metrics — team size managed, geographic reach, number of stakeholders coordinated, database size maintained. Scale shows the scope of your responsibility.
Most strong bullets combine two types: "Reduced onboarding time by 35% (time) for teams of 50+ new hires per quarter (volume)."
100+ Metric Examples by Role
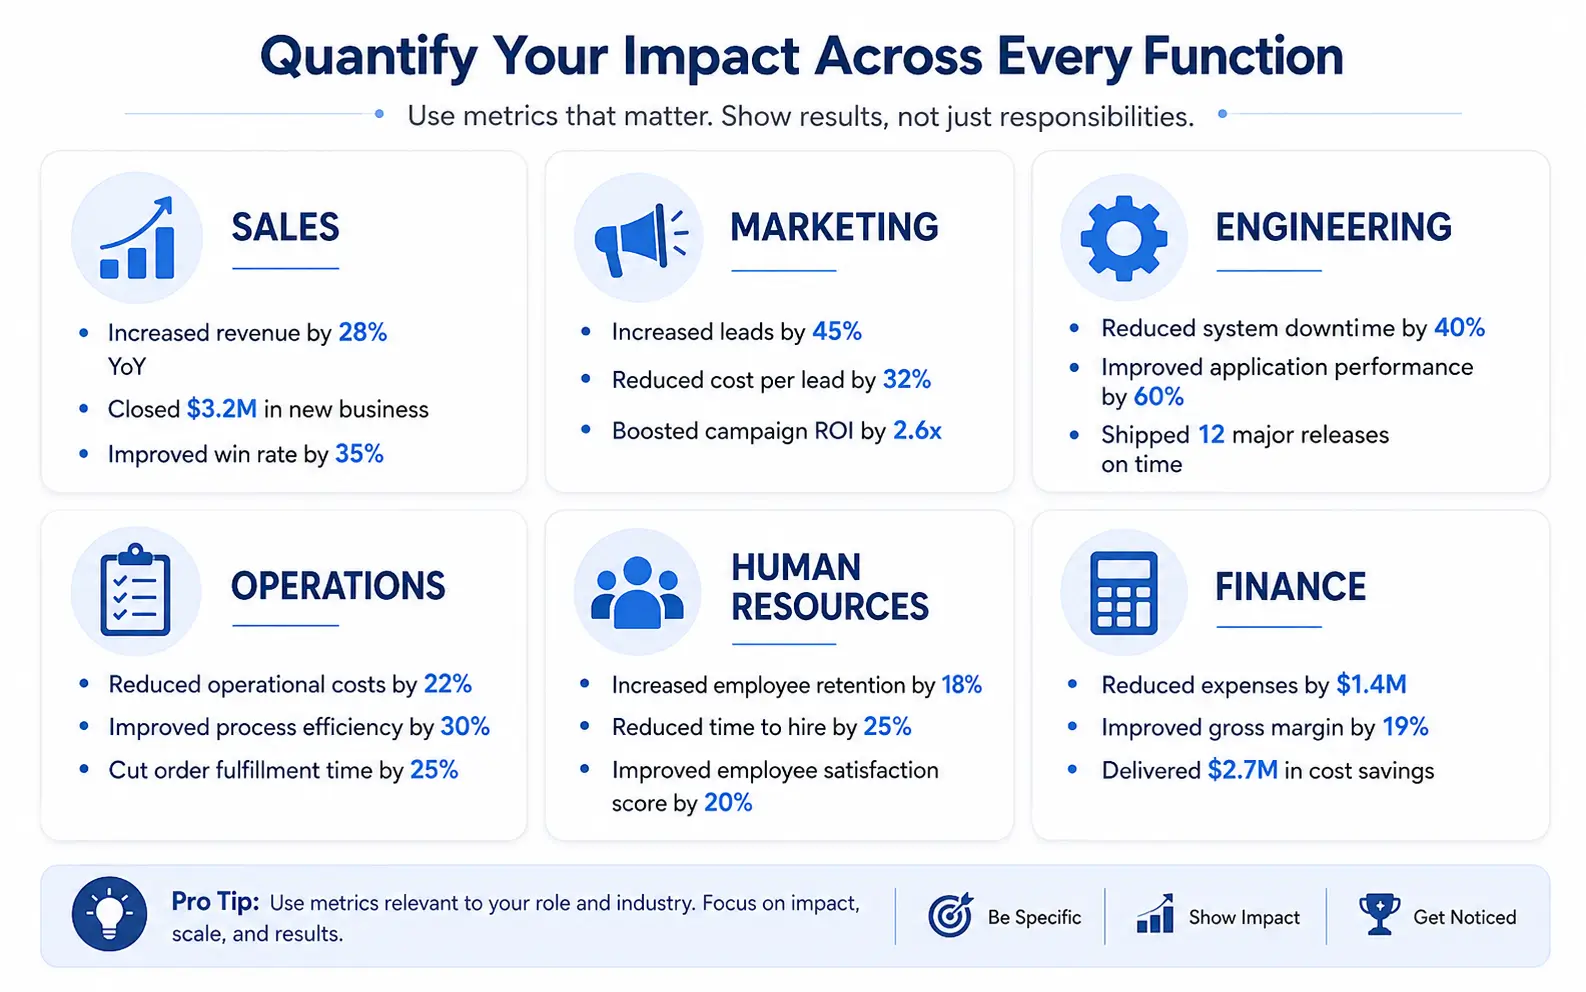
Below you'll find ready-to-adapt examples organized by function. Replace the specifics with your own numbers.
Sales & Business Development
1. Exceeded quarterly quota by 127%, closing $1.3M in new business revenue
2. Grew territory revenue from $800K to $2.4M within 18 months
3. Increased average deal size by 34% through consultative upselling
4. Generated 450+ qualified leads per quarter through cold outreach
5. Shortened average sales cycle from 90 to 52 days
6. Maintained 95% client retention rate across portfolio of 80+ accounts
7. Ranked #1 of 45 reps nationally for three consecutive quarters
8. Expanded customer base by 60% year-over-year in underserved market
9. Negotiated enterprise contracts averaging $250K annually
10. Achieved 112% of annual target, contributing $3.8M to team revenue
Marketing & Growth
11. Increased organic traffic by 185% over 12 months through content strategy
12. Reduced cost-per-acquisition from $42 to $18 via campaign optimization
13. Grew email subscriber list from 5K to 85K in 9 months
14. Generated $4.2M marketing-attributed pipeline in Q3 alone
15. Improved landing page conversion rate from 2.1% to 6.8%
16. Managed $500K monthly ad spend across 6 platforms with 4.2x ROAS
17. Launched influencer program reaching 2.3M impressions per campaign
18. Increased social media engagement by 230% quarter-over-quarter
19. Drove 40% increase in brand awareness (measured via unaided recall survey)
20. Reduced email unsubscribe rate from 1.8% to 0.4% through segmentation
Software Engineering & IT
21. Reduced page load time by 62%, improving user engagement by 15%
22. Built microservice handling 50K+ API requests per second at 99.9% uptime
23. Decreased deployment time from 4 hours to 12 minutes with CI/CD pipeline
24. Resolved 340+ production bugs, reducing critical incident rate by 78%
25. Migrated 2.3TB database with zero downtime during business hours
26. Wrote test suite covering 94% of codebase, catching 30+ bugs pre-release
27. Reduced infrastructure costs by $180K annually through cloud optimization
28. Led team of 8 engineers delivering features 3 sprints ahead of schedule
29. Improved application response time by 45% through query optimization
30. Automated 15 manual processes, saving engineering team 20 hours weekly
Data & Analytics
31. Built predictive model with 92% accuracy, reducing churn by 18%
32. Created dashboards used by 200+ stakeholders for daily decision-making
33. Processed and cleaned datasets of 50M+ records for analysis
34. Identified $2.1M cost-saving opportunity through spend pattern analysis
35. Reduced reporting time from 3 days to 4 hours via automated pipelines
36. Improved recommendation engine accuracy by 25%, increasing AOV by $12
37. Designed A/B testing framework that ran 150+ experiments annually
38. Decreased data pipeline failures from 12/month to fewer than 1
39. Delivered insights that informed $15M product roadmap decision
40. Trained 45 non-technical stakeholders on self-service analytics tools
Product Management
41. Launched feature adopted by 73% of active users within first month
42. Increased user retention by 28% through onboarding flow redesign
43. Managed $3.2M product budget across 4 cross-functional squads
44. Reduced feature delivery cycle from 8 weeks to 3 weeks
45. Grew product revenue from $1.2M to $4.8M ARR in 2 years
46. Prioritized backlog of 200+ features using data-driven scoring framework
47. Achieved NPS increase from 32 to 67 through targeted UX improvements
48. Coordinated launches across 12 markets and 3 time zones simultaneously
49. Decreased customer support tickets by 40% through proactive in-app guidance
50. Led beta program with 500+ users, achieving 4.6/5 satisfaction rating
Operations & Supply Chain
51. Reduced order fulfillment time from 72 hours to 24 hours
52. Cut warehouse operating costs by 22% through layout optimization
53. Managed logistics for 15,000+ shipments monthly across 8 carriers
54. Decreased inventory shrinkage from 4.2% to 0.8%
55. Improved on-time delivery rate from 82% to 97%
56. Negotiated vendor contracts saving $340K annually
57. Streamlined procurement process, reducing purchase order cycle by 60%
58. Oversaw facility expansion increasing capacity by 40% under budget
59. Reduced returns rate from 12% to 4% through quality control improvements
60. Managed cross-dock operations processing 3,000+ units daily
Human Resources & Recruiting
61. Reduced time-to-fill from 52 days to 28 days across all open roles
62. Decreased voluntary turnover from 18% to 11% within 18 months
63. Managed recruiting for 200+ positions annually across 6 departments
64. Improved employee engagement scores from 3.2 to 4.4 (out of 5)
65. Reduced cost-per-hire by 35% through employer branding initiatives
66. Designed onboarding program rated 4.8/5 by 300+ new hires
67. Led DEI initiative increasing diverse candidate pipeline by 65%
68. Negotiated benefits package saving company $420K while improving coverage
69. Trained 150+ managers on performance coaching, improving review completion by 90%
70. Resolved 95% of employee relations cases within 5 business days
Finance & Accounting
71. Managed $25M annual budget with less than 1% variance to forecast
72. Reduced month-end close cycle from 12 days to 5 days
73. Identified $1.8M in tax savings through restructuring analysis
74. Processed 4,500+ invoices monthly with 99.7% accuracy
75. Improved cash flow forecasting accuracy from 78% to 95%
76. Led audit preparation resulting in zero material findings for 3 years
77. Reduced accounts receivable aging over 90 days by 60%
78. Automated financial reporting, saving team 30 hours per month
79. Negotiated credit terms improving working capital by $2.3M
80. Managed FP&A for business unit generating $180M annual revenue
Customer Success & Support
81. Maintained 97% customer satisfaction rating across 1,200+ tickets monthly
82. Reduced average resolution time from 48 hours to 6 hours
83. Managed portfolio of 85 enterprise accounts worth $12M ARR
84. Achieved 115% net revenue retention through strategic upselling
85. Decreased escalation rate by 45% through proactive health monitoring
86. Onboarded 200+ new customers with 94% activation within 30 days
87. Built knowledge base with 500+ articles, deflecting 30% of tickets
88. Increased CSAT from 3.8 to 4.7 through service process redesign
89. Retained 3 at-risk enterprise accounts worth combined $2.1M
90. Trained team of 15 agents, improving first-contact resolution by 25%
Project Management
91. Delivered 12 projects totaling $8M on time and 5% under budget
92. Coordinated 45+ cross-functional stakeholders across 3 time zones
93. Reduced project delivery timeline by 30% through Agile transformation
94. Managed risk register of 200+ items, with zero critical escalations
95. Improved resource utilization from 65% to 88% across 6 teams
96. Completed facility buildout 3 weeks ahead of schedule, saving $150K
97. Standardized PMO processes adopted by 8 departments organization-wide
98. Reduced scope creep incidents by 70% through change control framework
99. Led migration program affecting 10,000+ users with 99.5% adoption
100. Achieved PMP certification while managing $4M active portfolio
Healthcare & Education
101. Maintained 98% medication administration accuracy across 40+ patients daily
102. Reduced patient wait times by 35% through scheduling optimization
103. Improved student test scores by 22% over academic year
104. Managed caseload of 120+ patients with zero compliance violations
105. Designed curriculum adopted by 8 school districts, reaching 15,000 students
106. Decreased ER readmission rates by 18% through discharge planning
107. Achieved 96% patient satisfaction scores for 12 consecutive months
108. Trained 25 new nurses, with mentees averaging 15% higher competency scores
Creative & Design
109. Redesigned checkout flow increasing conversion by 32%
110. Produced 200+ assets monthly while reducing revision rounds by 50%
111. Grew YouTube channel from 0 to 50K subscribers in 8 months
112. Improved design system adoption from 40% to 95% across engineering teams
113. Reduced design-to-development handoff time by 60%
114. Led rebrand reaching 2M+ customers across 12 touchpoints
115. Increased email click-through rate by 45% through template redesign
116. Conducted 80+ user research interviews informing $5M product decision
How to Estimate When You Don't Have Exact Data
Most people skip metrics not because they have zero impact, but because they can't remember the precise number. Here's how to estimate responsibly:
Method 1: Use reasonable ranges. "Managed 15–20 client accounts" is better than "Managed client accounts." Ranges signal honesty while still providing scale.
Method 2: Calculate from what you know. If you handled roughly 10 support tickets daily, 5 days a week, for 2 years — that's approximately 5,000 tickets. Work backward from what you can verify.
Method 3: Use qualifiers. Words like "approximately," "over," "up to," and "nearly" let you claim impact without implying false precision. "Reduced processing time by approximately 40%" is accurate and impressive.
Method 4: Benchmark against averages. If you don't know your exact numbers, research industry benchmarks. "Exceeded industry-average close rate of 20% by maintaining 31% close rate" uses external data to frame your performance.
Method 5: Ask former colleagues or check old reports. Before your next application, reach out to former managers or check if you have access to old performance reviews, dashboards, or reports that captured your metrics.
Method 6: Use time-based proxies. "Saved team approximately 10 hours weekly" can be derived from knowing a manual process took 2 hours and you automated it for a 5-person team.
The key rule: estimate conservatively and never fabricate. Interviewers will ask you to explain your numbers. A reasonable estimate you can defend is infinitely better than an exact number you invented.
Turning STAR Stories Into Metric-Rich Bullets
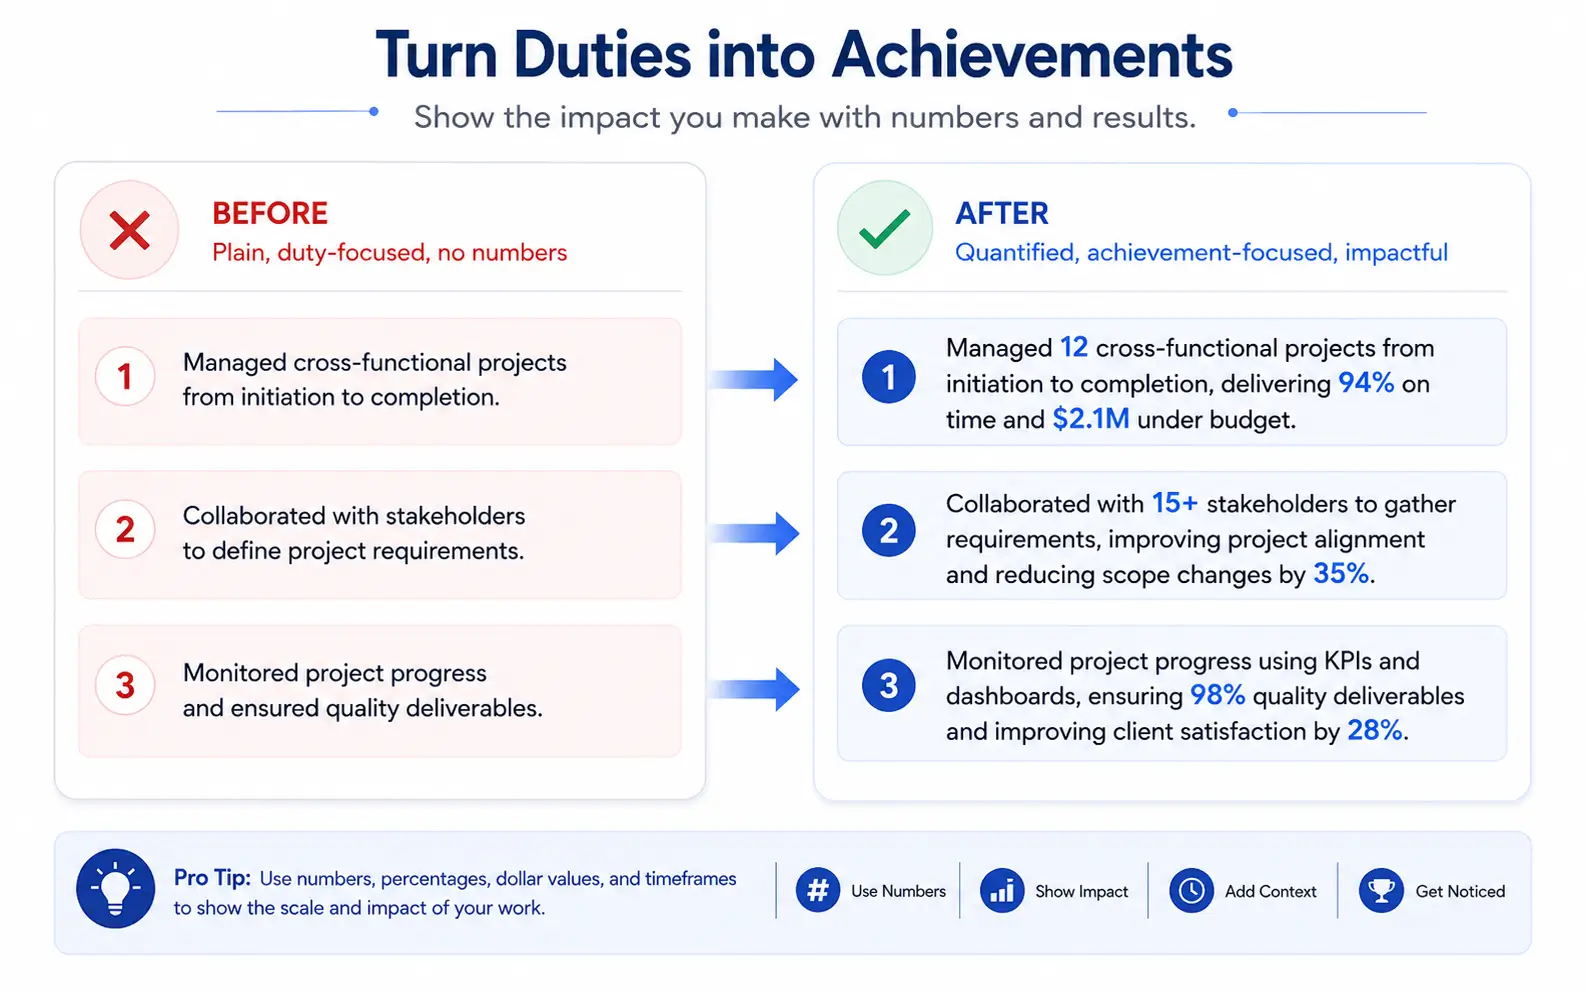
If you've prepared behavioral interview answers using the STAR method (Situation, Task, Action, Result), you already have the raw material for quantified bullets. Here's how to convert them:
STAR story: "In my previous role, the onboarding process was slow and confusing for new hires. I was tasked with improving it. I redesigned the entire workflow and created new training materials. As a result, new hires became productive faster."
Metric bullet: "Redesigned employee onboarding workflow, reducing time-to-productivity from 6 weeks to 3 weeks for 50+ annual new hires."
The conversion formula:
- Strip the narrative down to the core action
- Identify the measurable "before" state
- Identify the measurable "after" state
- Add scope or scale context
Try this with every STAR story you have — you'll uncover metrics you didn't realize existed.
Tools like Seekario's AI Resume Builder can help you transform duty-based bullets into achievement-focused statements with suggested metrics based on your role and industry.
Metrics to Avoid on Your Resume
Not every number strengthens your resume. Skip these:
Irrelevant metrics. Citing "Sent 200+ emails daily" doesn't demonstrate achievement — it describes activity. Focus on outcomes, not outputs.
Metrics that expose problems. "Reduced my error rate from 25% to 5%" raises the question of why your error rate was ever at 25%.
Unverifiable exaggerations. Claiming "Generated $50M in revenue" as a junior associate will trigger skepticism. Make sure your claimed impact matches your level.
Vanity metrics without context. "Gained 10,000 followers" means nothing without conversion or engagement context.
Confidential data. Exact revenue figures, client names, or proprietary performance data that your NDA prohibits sharing. Use percentages instead: "Grew revenue by 45%" protects specifics while showing impact.
Putting It All Together
Every bullet on your resume is an opportunity to prove your value with data. Use this checklist before submitting any application:
- Does each role have at least 2–3 quantified bullets?
- Do your metrics span multiple types (money, time, volume, quality, scale)?
- Are your estimates conservative and defensible?
- Do your numbers match the seniority level of the role?
- Have you removed any metrics that don't serve the target job?
If you want to speed up the process, Seekario's AI Resume Tailor analyzes job descriptions and suggests which of your achievements to highlight — complete with metric recommendations matched to what the employer values most.
For a full guide on structuring every part of your resume, check out The Complete Guide to Resume Sections.
FAQ
How many metrics should I include on my resume?
Aim for 2–3 quantified bullets per role. For your most recent position, you might have 4–5. Not every bullet needs a number, but your strongest achievements absolutely should.
Is it okay to estimate numbers on my resume?
Yes — conservative estimates are standard practice. Use qualifiers like "approximately" or "over" when you're not certain of exact figures. The key is that you can explain your reasoning if asked in an interview.
What if my role doesn't involve numbers?
Every role has measurable impact. Teachers can cite student outcomes, designers can reference conversion lifts, and administrators can quantify process improvements. Think about time saved, people served, quality improved, or scope managed.
Should I use percentages or absolute numbers?
Use whichever is more impressive and relevant. "$2M revenue" is stronger than "15% increase" if the base was large. But "150% year-over-year growth" is more impressive than "$30K revenue" for a startup. When possible, include both: "Grew revenue by 150% ($30K to $75K)."
Can I use metrics from team achievements?
Yes, but frame them honestly. Use "Contributed to team effort that generated $5M" or "Led initiative within team that reduced costs by 20%." Claiming sole credit for team results will backfire in interviews.
Ready to transform your resume bullets with powerful metrics? Seekario's AI Resume Builder helps you craft achievement-focused bullet points with industry-relevant metrics — so every line proves your value to hiring managers.